Software developer by day - keyboard playing, rock god at evenings and weekends!
31 stories
·
2 followers

Unit Testing and Memory Profiling: Can They Be Combined?

3 Shares

Memory profilers can hardly be called an “everyday tool.” Typically, developers start thinking about profiling their product closer to its release. This approach may work fine until some last-minute issue like a leak or huge memory traffic crushes all your deadlines. The proactive approach would be to profile your app’s functionality on a daily basis, but who’s got the resources to do that? Well, we think there may be a solution.

If you employ unit testing in your development process, it is likely that you regularly run a number of tests on app logic. Now imagine that you can write some special “memory profiling” tests, e.g. a test that identifies leaks by checking memory for objects of particular type, or a test that tracks memory traffic and fails in case the traffic exceeds some threshold. This is exactly what dotMemory Unit framework allows you to do. The framework is distributed as a NuGet package and can be used to perform the following scenarios:

  • Checking memory for  objects of a certain type.

  • Checking memory traffic.

  • Getting the difference between memory snapshots.

  • Saving memory snapshots for further investigation in dotMemory (a standalone .NET memory profiler from JetBrains).

In other words, dotMemory Unit extends your unit testing framework with the functionality of a memory profiler.

IMPORTANT: dotMemory Unit is currently in the EAP (Early Access Program) stage. Please use it for evaluation purposes only!

How It Works

  • dotMemory Unit is distributed as a NuGet package installed to your test project:
    PM> Install-Package JetBrains.DotMemoryUnit -pre

  • dotMemory Unit requires ReSharper unit test runner. To run tests that use dotMemory Unit, you should have either dotCover 3.1 EAP or ReSharper 9.1 EAP05 installed on your system.

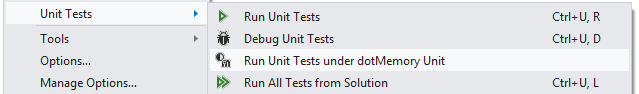
  • After you install the dotMemory Unit package, ReSharper’s menus for unit tests will include an additional item, Run Unit Tests under dotMemory Unit. In this mode, the test runner will execute dotMemory Unit calls as well as ordinary test logic. If you run a test the ‘normal’ way (without dotMemory Unit support), all dotMemory Unit calls will be ignored.

    Unit Tests Menu

  • dotMemory Unit works with all of the unit-testing frameworks supported by ReSharper’s unit test runner including MSTest and NUnit.

  • A standalone launcher for integrating with CI systems like JetBrains TeamCity is planned for future releases.

Now let’s take a look at some examples to better understand what dotMemory Unit does.

Example 1: Checking for Specific Objects

Let’s start with something simple. One of the most useful cases can be finding a leak by checking memory for objects of a specific type.

GetObjects Assertion

  1. A lambda is passed to the Check method of the static dotMemory class. This method will be called only in case you run the test using Run test under dotMemory Unit.

  2. The memory object passed to the lambda contains all memory data for the current execution point.

  3. The GetObjects method returns a set of objects that match the condition passed in another lambda. This line slices the memory by leaving only objects of the Foo type. The Assert expression asserts that there should be 0 objects of the Foo type.
    Note that dotMemory Unit does not force you to use any specific Assert syntax. Simply use the syntax of the framework your test is written for. For example, the line in the example uses NUnit syntax but could be easily updated for MSTest:
    MSTest Assertion

With dotMemory Unit you can select a set of objects by almost any condition, get the number of objects in this set and their size, and use these data in your assertions.
In the following example, we check for objects in the large object heap:

Checking for Specific Objects


Example 2: Checking Memory Traffic

The test for checking memory traffic is even simpler. All you need do to is mark the test with the AssertTraffic attribute. In the example below, we assert that the amount of memory allocated by all the code in TestMethod1 does not exceed 1,000 bytes.

AssertTraffic Attribute Example

Example 3: Complex Scenarios for Checking Memory Traffic

If you need to get more complex information about memory traffic (say, check for traffic of objects of a particular type during some specific time interval), you can use a similar approach to the one from the first example. The lambdas passed to the dotMemory.Check method slice and dice traffic data by various conditions.

Check Traffic with Traffic Type

  1. To mark time intervals where memory traffic can be analyzed, use checkpoints created by dotMemory.Check (as you probably guessed, this method simply takes a memory snapshot).

  2. The checkpoint that defines the starting point of the interval is passed to the GetTrafficFrom method.
    For example, this line asserts that the total size of objects implementing the IFoo interface created in the interval between memoryCheckPoint1 and memoryCheckPoint2 is less than 1,000 bytes.

  3. You can get traffic data for any checkpoint that was set earlier. Thus, this line gets traffic between the current dotMemory.Check call and memoryCheckPoint2.

Example 4: Comparing Snapshots

Like in the ‘standalone’ dotMemory profiler, you can use checkpoints not only to compare traffic but for all kinds of snapshot comparisons. In the example below we assert that no objects from the MyApp namespace survived garbage collection in the interval between memoryCheckPoint1 and the second dotMemory.Check call.

Compare Snapshots

Conclusion

dotMemory Unit is very flexible and allows you to check almost any aspect of app memory usage. Use “memory” tests in the same way as unit tests on app logic:

  • After you manually find an issue (such as a leak), write a memory test that covers it.

  • Write tests for proactive testing – to ensure that new product features do not create any memory issues, like objects left in memory or large traffic.

Thanks for reading and don’t hesitate to try dotMemory Unit EAP on your own! It’s absolutely free, and the only requirement is ReSharper or dotCover installed on your machine.

Read the whole story
ianreah
3329 days ago
reply
Cramlington, United Kingdom
Wilka
3331 days ago
reply
Newcastle, United Kingdom
Share this story
Delete

Show Your Work: Demonstrating Progress on Your Projects

2 Shares

I’ve been thinking a lot lately about how actual progress on a project doesn’t always match the impression of progress—sometimes a lot of code has changed but nothing looks very different, while other times a small change in code gives the sense that the whole project has moved leaps and bounds.

This came up recently because of how my team had been prioritizing bug fixes on a responsive redesign project. Our normal process is that after sharing an early version of a responsive prototype with the client or internal stakeholder, we create a ton of bug reports (GitHub issues, in our case) that act as to-dos as we move through the project. Depending on the project, the issues are usually grouped by content type (“all the variations of portfolio styles”) or by section (“all the sidebars”). The highest priority issues are any that block other people from doing their work, and after that, order of fixing is largely left to the discretion of the developer.

On this particular project, lots of fixes were being committed and pushed out to the development site, but when I reloaded the pages nothing looked very different. Two weeks passed and everything still looked pretty much the same. I knew work was being done, but I couldn’t see where.

Finally, exasperated at what seemed like a lack of progress, I asked the team why they hadn’t fixed what felt like a huge, obvious bug to me: images were being scaled to larger than their actual image size at some breakpoints and looked pixelated and crappy. “Oh,” one developer said, “that’s a popcorn task: super easy and fast, and I like to leave those fixes to the end. I start with the complicated issues first so I have the most time to work on them.” Another developer explained that the display bugs in the header and main navigation weren’t slated to be addressed until she had finished styling the news archives.

When it comes to front-end development, many of the trickiest issues are subtle—the way a table resizes at a middle breakpoint, or line heights adjust as the viewport size changes. On this site, the glaring issues that were clearest to a non-developer—the ratio of column widths, wonky margins, and broken images—kept getting shoved to the back of the queue, where it looked to me (and our client) like no one was paying attention to them. And of course an ugly and broken header is going to stay that way as long as the team is focused on styling the news section instead.

For the next few weeks of the project, we tried something new and tagged some of the issues as “visually important.” Those issues got addressed early even if they were simple or not part of the section in focus, based on our judgment that fixing them would add to the impression of progress on the development site. Each week when I reviewed the site, I saw headers now properly aligned, new snazzy CSS transitions, and trendy border-radiused circular profile images.

By the end of the phase, we had fixed all the same bugs that we normally would have. But by strategically addressing the visually obvious issues, we created an external sense of progress for our stakeholders that was a more accurate reflection of the amount of work going into the code.

Iteration is a hot topic right now, and many of us are moving toward sharing earlier and messier versions of a site with our stakeholders. We put a lot of care and attention on crafting a great user experience, but the end user isn’t the only one who needs to be pleased with the site. It’s worth adjusting the processes around how we present and work with rough prototypes in a way that provides a good client experience as well.

Read the whole story
Wilka
3453 days ago
reply
Newcastle, United Kingdom
ianreah
3456 days ago
reply
Cramlington, United Kingdom
Share this story
Delete

Fractal Zoom

1 Share

A quick search for “F# Mandelbrot” gave an article written by Luke Hoban back in 2007, that draws a Fractal to the console.

Time for a makeover with a sprinkling of Active patterns, Reactive programming, Parallel execution and Silverlight.

Simply draw a rectangle onto the Fractal to zoom in:

“Complex” maths using F# PowerPack library and an Active Pattern:

open Microsoft.FSharp.Math

let maxIteration = 255
let modSquared (c : Complex) = 
    c.RealPart * c.RealPart + c.ImaginaryPart * c.ImaginaryPart
    
let (|Escaped|DidNotEscape|) c =
    let rec compute z iterations =
        if(modSquared z >= 4.0) 
            then Escaped iterations
        elif iterations = maxIteration
            then DidNotEscape
        else compute ((z * z) + c) (iterations + 1)
    compute c 0

Tomas Petricek’s original Reactive Rectangles sample to select the zoom area:

let rec waiting() = async {
  let! md = Async.AwaitObservable(main.MouseLeftButtonDown)
  let rc = new Canvas(Background = transparentGray)
  main.Children.Add(rc) 
  do! drawing(rc, md.GetPosition(main)) }

and drawing(rc:Canvas, pos) = async {
  let! evt = Async.AwaitObservable(main.MouseLeftButtonUp, main.MouseMove)
  match evt with
  | Choice1Of2(up) -> 
      rc.Background <- SolidColorBrush(colorSelect.CurrentColor)
      do! waiting() 
  | Choice2Of2(move) ->
      moveControl rc pos (move.GetPosition(main))
      do! drawing(rc, pos) }

do waiting() |> Async.StartImmediate

Parallel rendering over up to 4 cores using Async workflows:

do! [0..3] 
    |> List.map (fun y -> async {
        render points (y,(height/4),4) buffer
    })
    |> Async.Parallel

Resources:

Source: FractalZoom.zip (3.89 kb)


Currently rated 5.0 by 3 people

  • Currently 5.0/5 Stars.
  • 1
  • 2
  • 3
  • 4
  • 5
Read the whole story
ianreah
3561 days ago
reply
Cramlington, United Kingdom
Share this story
Delete

Offline Browsing Secrets In Chrome

1 Share
If you travel, you’ve probably found yourself stuck with zero network connectivity on more than one occasion. This sucks, especially if you just want to look up a few previously viewed pages to get some work done. Who are we … Continue reading
Read the whole story
ianreah
3569 days ago
reply
Cramlington, United Kingdom
Share this story
Delete

How to review a merge commit

3 Shares

Git does a pretty amazing job when it merges one branch into another. Most of the time, it merges without conflict. In a fairy tale world with rainbow skittles and peanut butter butterflies, every merge would be without conflict. But we live in the real world where it rains a lot and where merge conflicts are an inevitable fact of life.

Is this what an Octopus merge looks like? - Dhaka traffic by Ranveig Thatta license CC BY 2.0

Git can only do so much to resolve conflicts. If two developers change the same line of code in different ways, someone has to figure out what the end result should be. That can't be done automatically.

The impact of merge conflicts can be mitigated by doing work in small iterations and merging often. But even so, the occasional long running branch and gnarly merge conflict are unavoidable.

Often, we treat the work to resolve a merge conflict as trivial. Worse, merges often are not reviewed very carefully (I'll explain why later). A major merge conflict may contain a significant amount amouut of work to resolve it. And any time there is significant work, others should probably review that code in a pull request (PR for short). After all, a bad merge conflict resolution could introduce or reintroduce subtle bugs that were presumed to be fixed already.

As a great example, take a look at the recent Apple Goto Fail bug. I'm not suggesting this was the result of a bad merge conflict resolution, but you could easily see how a bad merge conflict might produce such a bug and bypass careful code review.

if ((err = SSLHashSHA1.update(&hashCtx, &serverRandom)) != 0) goto fail; if ((err = SSLHashSHA1.update(&hashCtx, @signedParams)) != 0) goto fail; goto fail; if ((err = SSLHashSHA1.final(&hashCtx, &hashOut)) != 0) goto fail; 

When my team is in this situation, we actually push the merge commit into its own branch and send a pull request.

For example, suppose I want to merge the master branch into a branch named long-running-branch. I'll create a new branch named something like merge-master-into-long-running-branch. I'll then perform the merge in that branch (when I am resolving a gnarly merge my outbursts can be rightly described as a performance). When I'm done and everything is working, I'll push that new branch to GitHub and create a pull request from it for others to review.

In git that looks like:

git checkout long-running-branch git checkout -b merge-master-into-long-running-branch git merge master # Manually do a lot of work to resolve the conflicts and commit those changes git push origin merge-master-into-long-running-branch 

The first command just makes sure I'm in the long-running-branch. The second command uses the -b to create a new branch named merge-master-into-long-running-branch based off the current one. I then merge master into this branch. And finally I push it to GitHub.

That way, someone can do a quick review to make sure the merge doesn't break anything and merge it in.

However, this runs into some problems as articulated by my quotable co-worker Paul Betts. In a recent merge commit PR that I sent, he made the following comment just before he merged my PR.

I have no idea how to review a merge commit

The problem he alludes to is that when you merge one branch into another, the diff of that merge commit will show every change since the last merge. For the most part, that's all code that's already been reviewed and doesn't need to be reviewed again.

What you really want to look at is whether there were conflicts and what shenanigans did the person have to do to resolve those conflicts.

Well my hero Russell Belfer (no blog, but he's @arrbee on Twitter) to the rescue! He works on LibGit2 so as you'd expect, he knows a thing or two about how Git works.

Recall that when you merge one branch into another, a new merge commit is created that points to both branches. In fact, a merge commit may have two or more parents as it's possible to merge multiple branches into one at the same time. But in most cases a merge commit has exactly two parents.

Let's look at an example of such a merge commit from the SignalR project. This commit merges their release branch into their dev branch. The SHA for this commit is cc5b002a5140e2d60184de42554a8737981c846c which is pretty easy to remember but to be fair to those with drug addled brains, I'll use cc5b002a as a shorthand to reference this commit.

You can use git diff to look at either side of the merge. For example:

git diff cc5b002a^1 cc5b002a git diff cc5b002a^2 cc5b002a 

Recall that the ^ caret is used to denote which parent of a commit we want to look at. So ^1 is the first parent, ^2 is the second parent, and so on.

So how do we see only the lines that changed as part of the conflict resolution?

git diff-tree --cc cc5b002a 

UPDATE: I just now learned from @jspahrsummers that git show cc5b002a works just as well and in my shell gives you the color coded diff. The merge commit generally won't contain any content except for the conflict resolution.

git show --cc cc5b002a 

As I'll show later, the --cc option is useful for finding interesting commits like this.

You can see the output of the gist show command in this gist. Notice how much less there is there compared to the full diff of the merge commit.

The git diff-tree command is a lower level command and if I had to guess, git show builds on top of it.

If we look at the git diff-tree documentation, we can see that the --cc flag is the one that's interesting to us.

--cc This flag changes the way a merge commit patch is displayed, in a similar way to the -c option. It implies the -c and -p options and further compresses the patch output by omitting uninteresting hunks whose the contents in the parents have only two variants and the merge result picks one of them without modification. When all hunks are uninteresting, the commit itself and the commit log message is not shown, just like in any other "empty diff" case.

Since the --cc option describes itself in terms of the -c option, let's look at that too.

-c This flag changes the way a merge commit is displayed (which means it is useful only when the command is given one , or --stdin). It shows the differences from each of the parents to the merge result simultaneously instead of showing pairwise diff between a parent and the result one at a time (which is what the -m option does). Furthermore, it lists only files which were modified from all parents.

The -p option mentioned generates a patch output rather than a normal diff output.

If you're not well versed in Git (and perhaps even if you are) that's a mouthful to read and a bit hard to fully understand what it's saying. But the outcome of the flag is simple. This option displays ONLY what is different in this commit from all of the parents of this commit. If there were no conflicts, this would be empty. But if there were conflicts, it shows us what changed in order to resolve the conflicts.

As I mentioned earlier, the work to resolve a merge conflict could itself introduce bugs. This technique provides a handy tool to help focus a code review on those changes and reduce the risk of bugs. Now go review some code!

If you're wondering how I found this example commit, I ran git log --min-parents=2 -p --cc and looked for a commit with a diff.

That filters the git log with commits that have at least two parents.

Read the whole story
ianreah
3704 days ago
reply
Cramlington, United Kingdom
Share this story
Delete

Scrum != Agile | Dr Dobb's

1 Share

December 03, 2013

If what you're doing is Scrum in isolation, it won't work. Scrum requires a much larger corporate culture of agility.

Full-bore agile is the only software-development process I know that actually works (and believe me, I've tried many). Nonetheless, I'm afraid that Agile might go the way of the dodo. Think about OO, which was pronounced dead several years ago. Those who put OO in a premature grave, however, usually aren't doing OO. Their ad-hoc if-I'm-using-an-OO-language-and-following-the-vendor's-rules-it-must-be-OO methodology is now eating brains in the cemetery at midnight. Don't confuse what they were doing with OO, though. Real OO is valuable.

Which brings me to agile. More and more lately, I've been seeing the press (including some parts of the press that ought to know better) saying things like "Scrum—the most popular of the agile methodologies..." This equating of Scrum and agile is worrisome. Scrum and agile are by no means the same thing.

First of all, agile in the true sense of the word (flexible, innovative, customer focused) is a culture—it's something that infuses the whole organization. It's not a process, and it's not limited to the engineering department. That's one of the reasons that I don't like to use capital-A "Agile." Agile should mean "agile," as in English, as in "able to move quickly and easily." It's not Agile(tm). When the company can move quickly and easily, it's agile.

So, let's look at how a culture mismatch can subvert agility. If an agile team needs some sort of resource (software, training, whatever) to complete the current development iteration, they need it right now. If, however, your organization puts massive delays in the process of acquiring that resource—sign-offs up the management hierarchy and six weeks to cut a check, for example—the team simply won't get the resource soon enough for it to be useful. So, engineering can't function in an agile way if the finance department isn't equally agile.

Another example: An agile philosophy implies short release (not development, but release) cycles to get feedback from real users as soon as possible, and that feedback should immediately feed into the next iteration. If an organization releases semi-annually, or even if there's a three-week delay while the finished code wends its way though production, you won't get that feedback soon enough.

Without a company-wide culture, no agile process will work. Which brings us back to Scrum. Scrum is not a culture. It's a process. So, Scrum won't work outside the context of a supporting culture.

Moreover, Scrum isn't even a complete process. Take XP, which is a full-blown process to my mind. XP is made up of 12 interlocking practices. One of those is planning. Scrum is little more than a formalization of the XP "planning game," which is to say that it represents 1/12 of the full process. Kent Beck pointed out in his "Extreme Programming Explained" that the practices that make up XP are tightly interlocked. For example, if you're not doing pervasive and early unit testing, it's difficult to refactor safely. In fact, Beck said, if you're not doing at least 80% of XP, you'll see only 20% of its benefit. You can't cherry pick the practices you like, because the practices influence each other. And I'm not even talking about how engineering-department processes interact with other processes in other departments. If what you're doing is Scrum in isolation, you're down in 20%-effective land (or lower).

This doesn't mean that Scrum isn't valuable, but it does mean that Scrum can't stand alone. Without the culture, Scrum will fail. My fear is that people will look at the many failed or dysfunctional Scrum shops and start saying "agile doesn't work." That's the danger of imagining that Scrum and agile are equivalent, and we need to push back hard whenever we hear somebody say that.

Read the whole story
ianreah
3786 days ago
reply
Cramlington, United Kingdom
Share this story
Delete
Next Page of Stories